基于Prometheus+Grafana搭建性能监控系统
基于Prometheus+Grafana搭建性能监测工具
需求
监测数据类型:JVM数据、玩家在线人数、消息时延等
接入Prometheus性能监测工具,暴露服务器性能监测数据
- 模式:pull/push
接入Grafana可视化数据
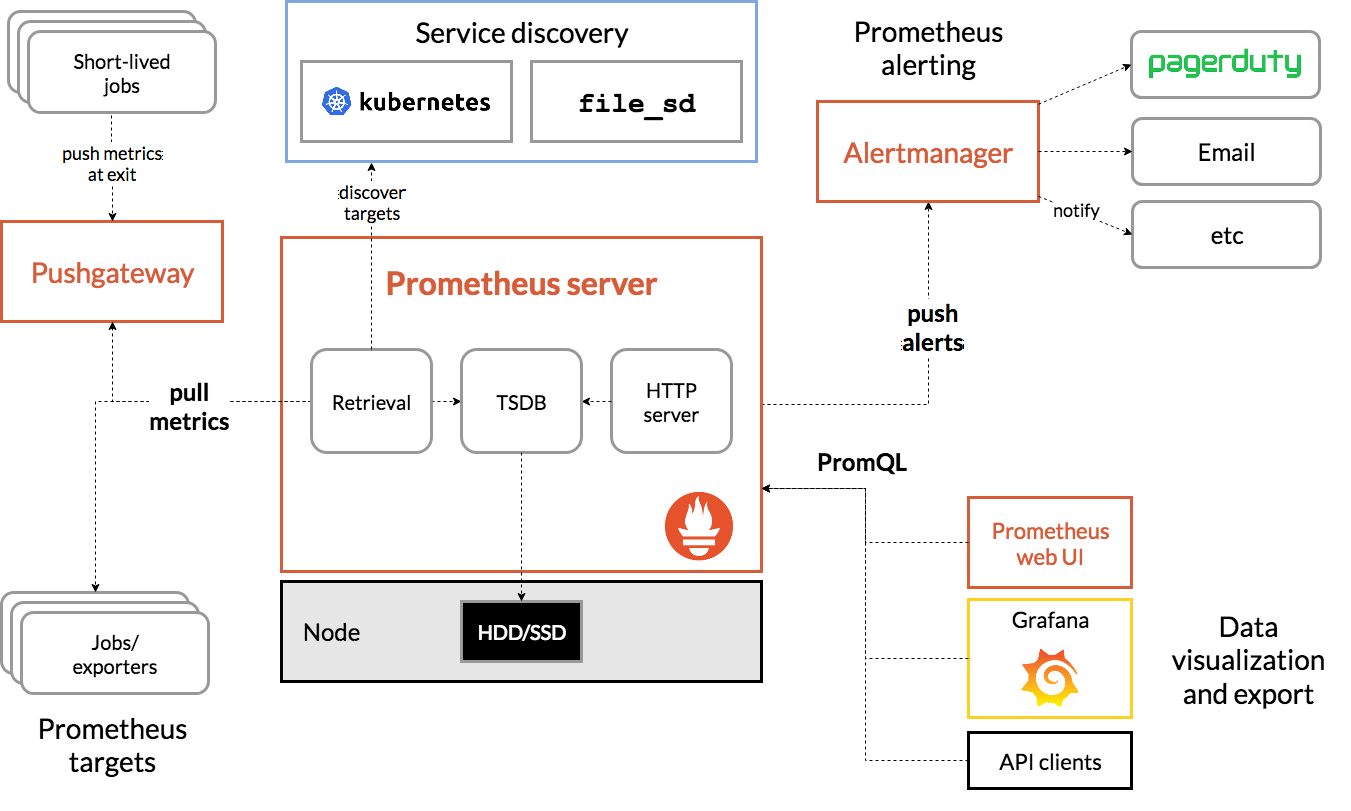
Prometheus框架图
搭建流程
准备环境
Java客户端配置
1 | |
配置文件
在本文的背景下,需要配置俩个文件:
1.jmx 的yaml文件,主要用于管理JMX Exporter的数据,即需要暴露的JVM参数;
jmx 的yaml文件
其中hostPort,username,password可以选择先屏蔽掉
1 | |
2.prometheus服务器的运行配置文件,注意替换配置文件中的ip和port
● ip直接设置为本机IP, windows下ipconfig可以查询,Mac下ipconfig
● 在pull模式下,配置的port1为暴露的Http端口
● 在push模式下,配置的port2为push-gateway运行的端口
1 | |
部署 Prometheus
1 | |
部署 Prometheus-PushGateWay
1 | |
部署 Grafana
1 | |
启动后,访问:http://localhost:3000,默认用户名密码 admin/admin。
添加 Prometheus 数据源
Settings->Data sources -> Add data source -> Prometheus
● 在HTTP URL中填写本机IP+Prometheus服务器运行的port.
● HTTP Method选择Get方法
常见问题
1.Error reading Prometheus: An error occurred within the plugin
将添加数据源的ip设置为本机ip,当设置为localhost时由于容器环境运行的grafana,所以localhost在容器内部可能有自己的定义。
2.prometheus有数据 grafana无数据
grafana可以通过PromeSQL语句查询对应的参数
Prometheus | Grafana导入模板后发现没有数据排查步骤 - 墨天轮
prometheus+grafana监控jvm,grafana上没有数据_吃葡萄不吐西瓜皮~的博客-CSDN博客_grafana没有监控数据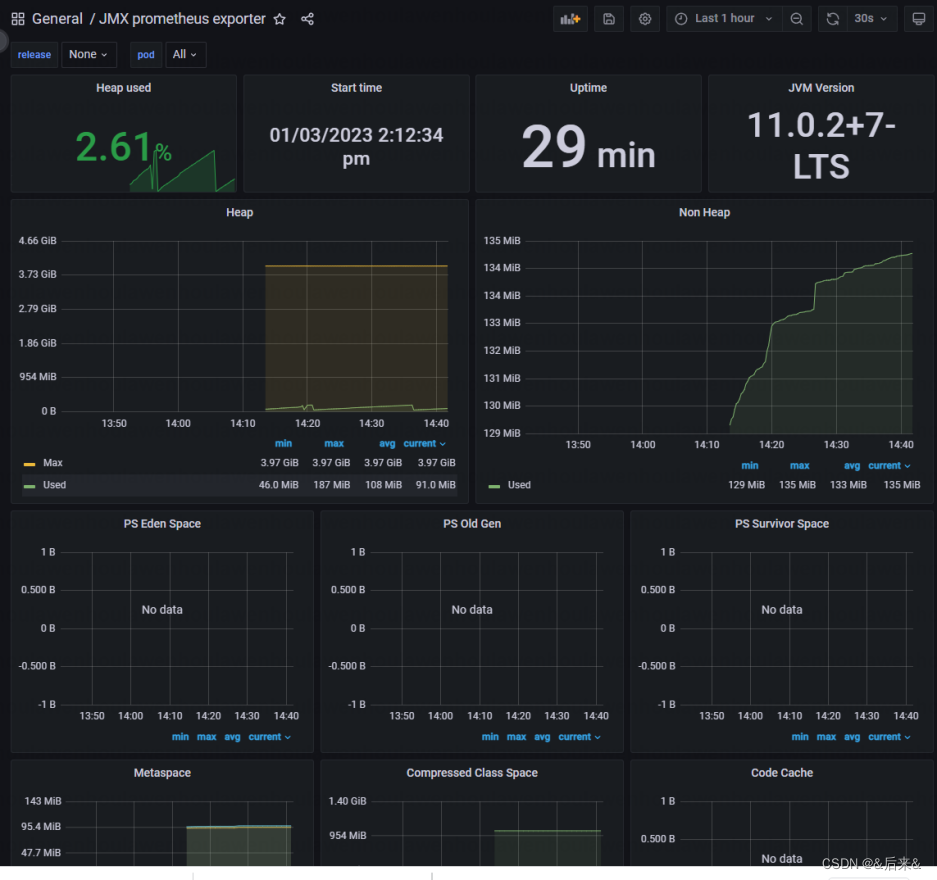
3 Prometheus Histogram
prometheus的histogram是一个累计直方图,正常理解直方图的桶内时对应范围(a<x<b)的数据,prometheus的直方图的桶是累计的值,即当前这个桶的数据包含前一个桶,方便函数筛选,用户最后自己想要啥数据,自己用函数筛选;使用计时相关的api单位默认就是秒,自定义的数据类型就是自定义的数据类型对应的单位。
rate(histogram_showcase_metric_bucket[1m]) 查看每个 bucket 的每秒变化率来了解这些 bucket 是如何随时间变化;histogram_quantile() 可以计算出哪个 bucket 标签包含给定的分位数(例如第 95 个百分位数)。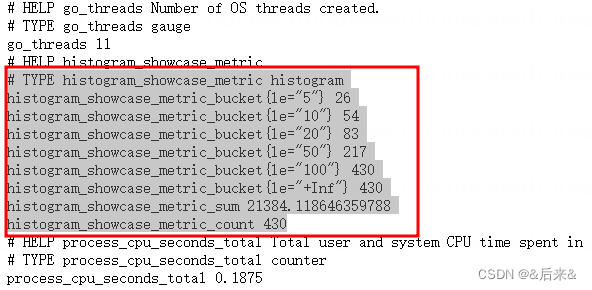
1 | |
一文搞懂 Prometheus 的直方图 - 腾讯云开发者社区-腾讯云
深入理解和使用 Prometheus 的 Histogram 指标类型 - 掘金
PromQL 直方图 跟踪请求的延迟或响应大小 99%的请求是在多少延迟下完成的?_富士康质检员张全蛋的博客-CSDN博客_promql 直方图
4.这俩行代码不在一个线程好像没法用?
1 | |
5. windows install curl
假设您是从https://curl.haxx.se/download.html获得的,只需将其解压缩到您想要的任何位置。无需安装。如果您打算使用 SSL,则需要下载 OpenSSL DLL,可从 curl 的网站获得。
下载卷曲压缩包
提取内容(如果您下载了正确的版本,您应该找到 curl.exe)
将 curl.exe 放在您保存软件的文件夹中(例如 D:\software\curl\curl.exe)
从命令行运行 curl
a) 右击“我的电脑”图标
b) 选择属性
c) 点击“高级系统设置”链接
d) 转到选项卡 [高级] - “环境变量”按钮
e) 在系统变量下选择“路径”和“编辑”按钮
f) 添加一个分号,后跟放置 curl.exe 的路径(例如;D:\software\curl)
现在您可以通过键入以下命令从命令行运行:
1 | |
参考文档
https://juejin.cn/post/6844904062157062151
https://cloud.tencent.com/developer/article/1495303