CoreDump
coredump是指当程序出错而异常中断时,OS会把程序工作的当前状态存储成一个coredunmp文件。通常情况下coredump文件包含了程序运行时的内存,寄存器状态,堆栈指针,内存管理信息等。百度百科
常见造成程序coredump的原因
内存访问越界(比如数组下标越界)
堆栈溢出(使用了过大的局部变量,因为局部变量存储在栈中,容易导致溢出;函数递归的深度太大等等)
非法指针(比如随意的强制转换指针的类型,或者使用了空指针(清理数据时,释放了指针所指向的内存地址,但没有将指针置空,导致其成为野指针。))
多线程读写的数据未加锁保护。
多线程程序使用了线程不安全的函数(比如strtok、gethostbyname等)。
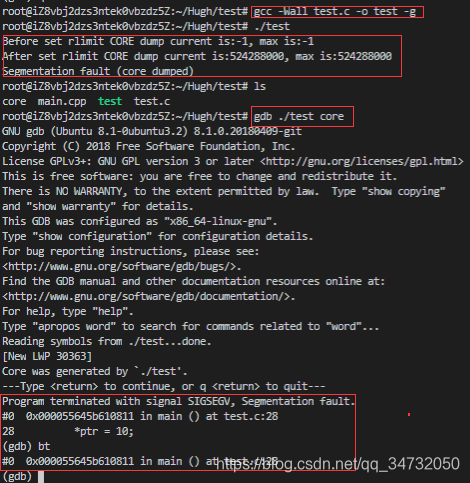
设置生成coredump文件 1 2 root@iZ8vbj2dzs3ntek0vbzdz5Z:~/Hugh/test
在Linux环境下,需要设置。这里输出结果为0,则表示未开启coredump功能。
开启coredump功能,并且不限制coredump文件大小。
1
2
root@iZ8vbj2dzs3ntek0vbzdz5Z:~/Hugh/test
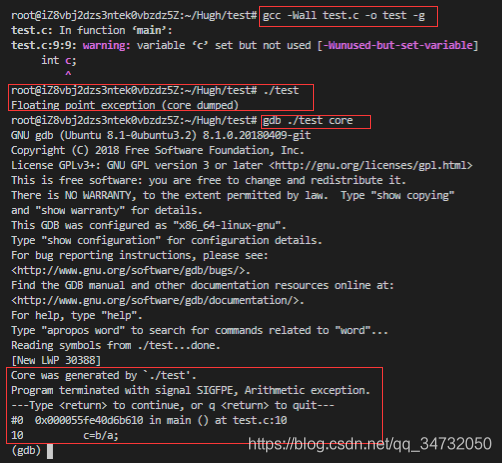
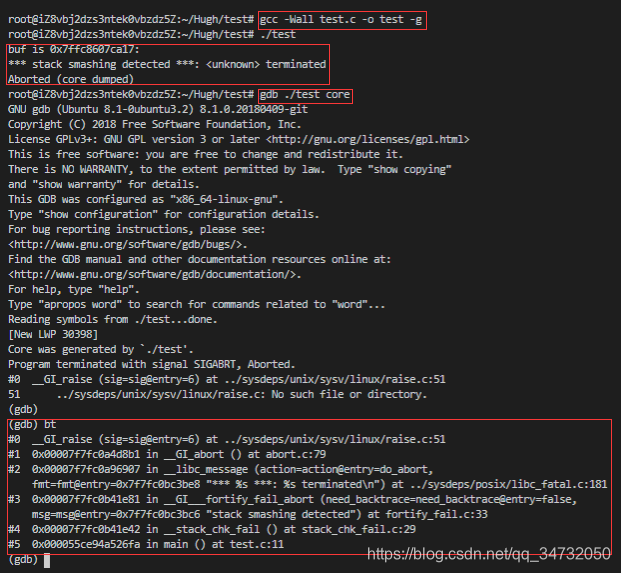
常用gdb来调试coredump问题 1 2 3 gdb program corefile where )
1 2 3 4 5 6 7 8 9 10 11 12 13 14 15 16 17 18 19 20 21 22 23 24 25 26 27 28 29 30 31 #include <unistd.h> #include <sys/time.h> #include <sys/resource.h> #include <stdio.h> #define CORE_SIZE 1024 * 1024 * 500 int main () struct rlimit rlmt ;if (getrlimit(RLIMIT_CORE, &rlmt) == -1 ) {return -1 ; printf ("Before set rlimit CORE dump current is:%d, max is:%d\n" , (int )rlmt.rlim_cur, (int )rlmt.rlim_max);rlim_t )CORE_SIZE;rlim_t )CORE_SIZE;if (setrlimit(RLIMIT_CORE, &rlmt) == -1 ) {return -1 ; if (getrlimit(RLIMIT_CORE, &rlmt) == -1 ) {return -1 ; printf ("After set rlimit CORE dump current is:%d, max is:%d\n" , (int )rlmt.rlim_cur, (int )rlmt.rlim_max);int *ptr = NULL ;10 ; return 0 ;
通过查看core文件,发现错误的地方在 main函数里面。
常见错误举例
除0错误
1 2 3 4 5 6 7 8 9 10 11 12 #include <unistd.h> #include <sys/time.h> #include <sys/resource.h> #include <stdio.h> int main () int a=0 ;int b=1 ;int c;return 0 ;
内存越界
1 2 3 4 5 6 7 8 9 10 11 #include <stdio.h> #include <stdlib.h> #include <string.h> int main () char buf[1 ];1 ]=1 ;printf ("buf is %p:%s\n" ,buf,buf);return 0 ;
参考链接 C++中Segmentation fault(Core Dump)错误处理 Linux下core dump